


Miranda Moore
RDA Lead Assistant, Beacon Dentistry
09/01/2026
How to Reduce Dental Supply Costs and Improve Inventory Efficiency

~ 9 minutes to read
Search this topic for ten minutes and you will be told your supply spend should be 3 to 4 percent, or 4 to 6, or 5 to 6, or a flat 6, or 5 to 7, or 3 to 10. Every one of those numbers appears in a published article about dental practice overhead. They cannot all be right, and sorting them out is the reader’s real first problem.
So before any advice on how to reduce dental supply costs, here is the reconciliation. The published figures are not contradicting each other so much as measuring different things: some are targets set by professional guidance, one is observed behavior pulled from accounting data, and they are not all divided by the same denominator.
The pressure making this worth an afternoon is well documented. Since January 2021, prices for dental equipment and supplies have risen 23 percent while reimbursement averaged across all payer types has risen 19 percent, according to the ADA Health Policy Institute. Five straight years of costs outrunning reimbursement is what the ADA itself calls a fiscal squeeze. ZenOne works on one side of that equation, which is the side an owner can still control.
Also Read
- Dental Practice Overhead Benchmarks: Are You Spending Too Much?
- Average Markup from Dental Supply Companies: What Your Practice Is Actually Paying
- How to Compare Prices on Dental Supplies (Without Spending Hours Doing It)
Summary
Reducing dental supply costs starts with knowing your real number, which means supply spend divided by collections, coded cleanly and checked monthly rather than at year end. The ADA’s ceiling is 5 to 6 percent of collections, while dental CPA data puts the average practice at 7.3 percent of revenue, so most practices have a point or two to recover. The levers that move it, roughly in order of impact, are price comparison across distributors on your actual item list, consolidating duplicates into a written formulary, right sizing order quantities, eliminating rush orders through calculated reorder thresholds, and FIFO rotation to stop expiration write offs. Each one carries a catch, and the biggest catch of all is that cutting the wrong things costs more than it saves. Inventory efficiency is not a separate project from cost control. It is the mechanism.
First, Reconcile the Benchmarks
| Source | The figure | What it measures | Target or behavior |
|---|---|---|---|
| American Dental Association | 5 to 6 percent, plus about 2 percent for office supplies | Inventory costs as a share of collections | Target |
| Dental Economics (Allen Schiff, CPA) | 6 percent, inside a 60 percent overhead target | Dental supplies as a share of collections | Target |
| PorterKinney, CPA | 7.3 percent average, under 7 percent for the most profitable | Dental supplies as a share of revenue, from 10,000 data points collected 2020 to 2024 | Behavior |
Three things fall out of that table. The 5 to 6 percent figures are targets, not averages. The 7.3 percent figure is what practices actually do. And the denominators are not identical, since PorterKinney measures against revenue while the ADA measures against collections, so treat the gap as directional rather than as precise arithmetic.
Directional is still plenty. On $1 million in collections, one point of supply spend is $10,000 a year, and most practices are carrying one to two points more than the guidance says they should.
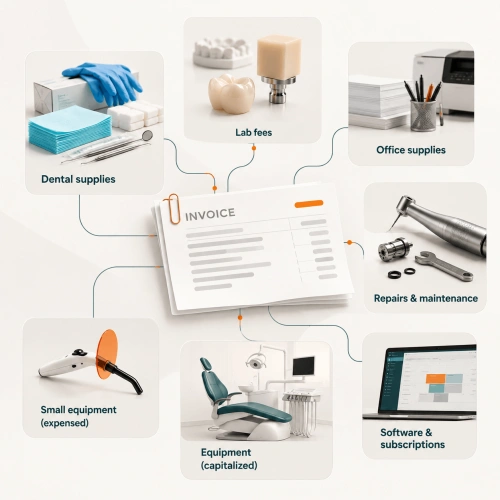
There is a second reason your own number may be wrong before you start. Writing in Dental Economics, CPA Allen Schiff warns that dental suppliers also sell equipment and equipment repairs, and when those disbursements get coded as supplies in the practice’s accounting software they distort the relationship between supplies and fee income. The ADA’s dividing line is $500 per item, not per invoice: below that it is a supply, above it is equipment.
What to do this week. Pull three months of supply spend, strip out equipment and repairs, divide by collections for the same period, and write the number down. Everything below depends on having it.
Know your number, then close the gap
Spend reporting against the collections benchmark, updated as you order rather than at year end. Book a Demo with ZenOne.
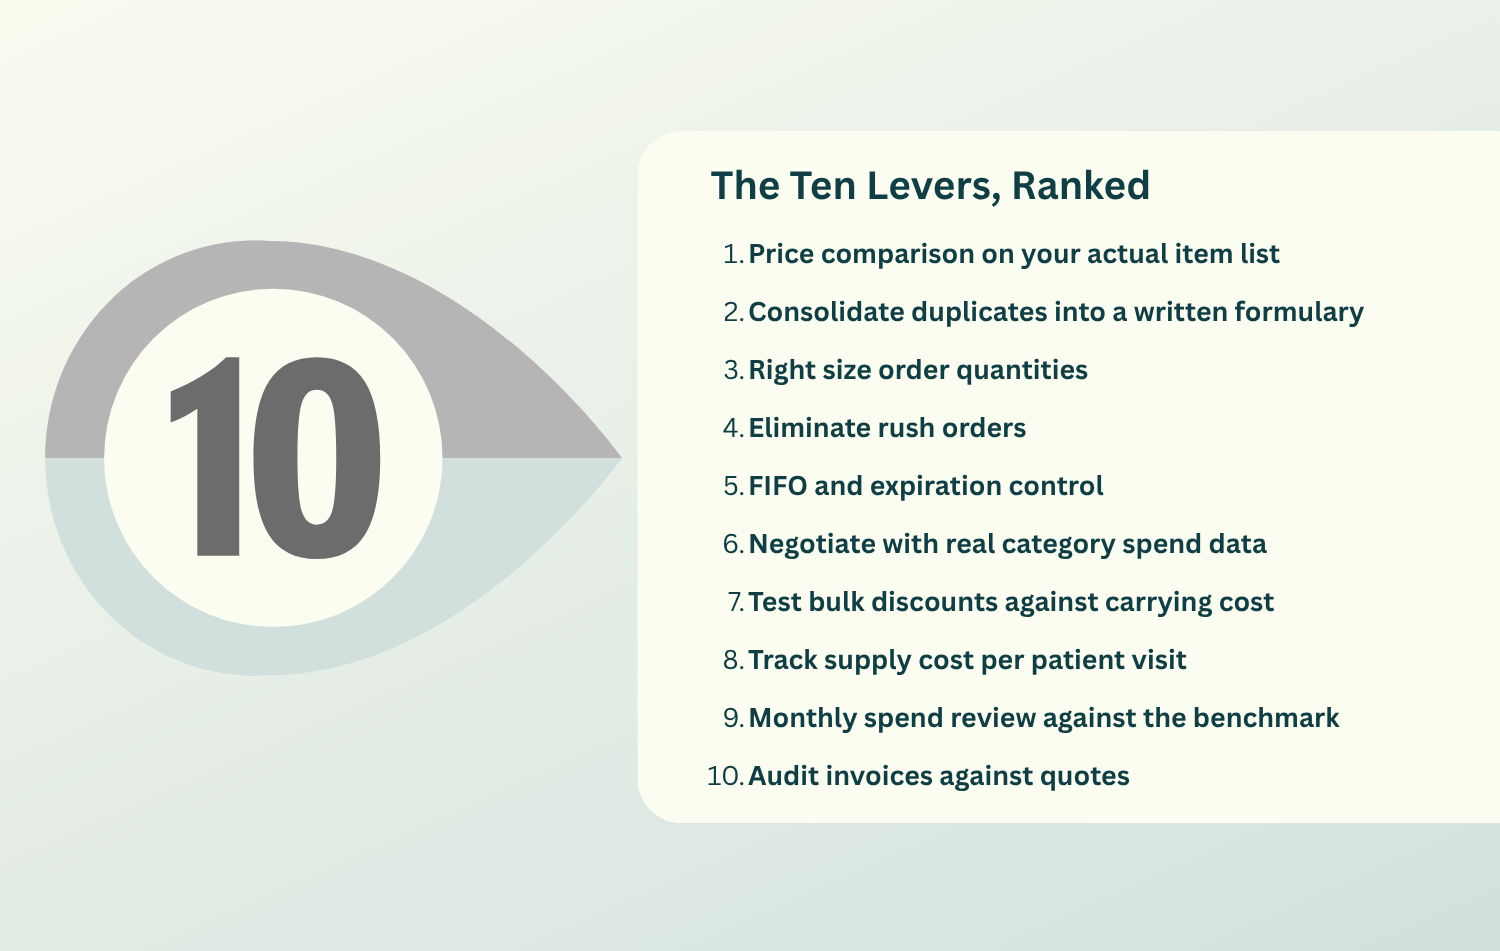
The Ten Levers, Ranked
Not every lever is worth the same effort, and a few of the popular ones are net negative once you do the arithmetic.
| # | Lever | Effort | Typical impact | The catch |
|---|---|---|---|---|
| 1 | Price comparison on your actual item list | Low with software, high by hand | Largest single lever | Has to run line by line at reorder, not annually |
| 2 | Consolidate duplicates into a written formulary | Medium | Large | Stops at clinically sensitive materials |
| 3 | Right size order quantities | Medium | Large | Requires an accurate count first |
| 4 | Eliminate rush orders | Low | Medium to large | Needs calculated thresholds, not discipline |
| 5 | FIFO and expiration control | Low | Medium | Fails silently if stock lives in three rooms |
| 6 | Negotiate with real category spend data | Medium | Medium | A complaint is not leverage; twelve months of data is |
| 7 | Test bulk discounts against carrying cost | Low | Small, sometimes negative | Thin discounts lose to carrying cost and expiry risk |
| 8 | Track supply cost per patient visit | Low | Detection, not savings | No published benchmark, so track your own trend |
| 9 | Monthly spend review against the benchmark | Low | Compounding | Only works if it stays on the calendar |
| 10 | Audit invoices against quotes | Low | Small but recurring | Contracted prices drift and nobody notices unsolicited |
Lever 1: price comparison on your actual item list
Pull 60 to 90 days of invoices, isolate the top 20 items by spend, and price each of them at three or more sources. Most of the money lives in a small number of line items, which is why comparing your whole catalog is a worse use of an afternoon than comparing the top of it.
The gap is structural, not accidental. Henry Schein tells its own investors that sales to large group customers are typically completed at lower gross margins as a result of higher sales volumes, while sales to office-based practitioners generally carry higher gross margins due to lower volumes. The negotiable band is real but bounded. The company reported a 25.0 percent gross margin across its whole Global Distribution and Value-Added Services segment in fiscal 2025, down from 25.8 percent the year before. That figure covers dental, medical, and international combined rather than US dental alone, but it tells you the band you are negotiating inside: there is room to move, and there is also a floor.
The catch is that unit price is the wrong comparison. Daniel Gordon, writing in Dental Economics, points out that the true cost of a purchase includes shipping, the hours spent shopping and tracking shipments, and the risk of receiving factory seconds for that great price. Free shipping minimums and lead times belong in the same calculation.
Lever 2: consolidate duplicates into a written formulary
One prophy paste, not five. Written down, posted, with an approval step required to add anything to the list.
The mechanism is proven at scale. Empire Dental Arts, an eight location group, saved over $200,000 in a single year with a formulary, distributor side spending limits, monthly profit and loss monitoring, and a quarterly leadership review. Those are group numbers and they will not transfer to a solo practice, but the mechanism does.
The catch matters more than the mechanism, though. A large share of what a practice buys is not clinically sensitive, and that is where standardization belongs. Force it across bonding agents and composites and you will get a compliance war, a private stash in operatory two, and a doctor who has stopped telling you what they order.
Levers 3, 4 and 5: the waste levers
Right size order quantities. Target four to six inventory turns a year, which works out to roughly 60 to 90 days on hand, according to Pearl. Holding inventory is not free: NetSuite puts carrying costs at 20 to 30 percent of total inventory value per year, so $40,000 on the shelves costs $8,000 to $12,000 a year in cash you cannot deploy.
Eliminate rush orders. Expedited freight typically runs two to three times the cost of standard shipping, and small emergency orders also miss free shipping minimums, so the penalty compounds exactly when you can least afford it. The root cause is always the same and it is not a discipline problem. It is the absence of a calculated reorder threshold and a fixed ordering schedule.
FIFO and expiration control. Date and label on receipt, shelve new stock behind old, and flag anything 60 to 90 days from expiry while it can still be used. Healthcare supply chain firm BlueBin estimates that expired product runs 8 to 10 percent of annual supply spend at typical health systems, and under 1 percent where visibility is good. Those are hospital figures, but the mechanism is identical at three operatories. This is the cheapest lever on the list: no negotiation, no vendor change, no software required, just shelving discipline and one storage location. It also fails the most quietly, because FIFO cannot work when stock lives in three rooms.

The Formulas Worth Running
Percent of collections
Supply spend divided by collections for the same period, times 100. Benchmark 5 to 6 percent per the ADA, and remember to strip equipment and repairs out of the numerator first.
Supply cost per patient visit
Supply spend divided by patient visits in the period. There is no published benchmark, which is the point: track it against your own history. Percent of collections improves on its own when you raise fees, with no change in behavior whatsoever. Cost per visit does not, which makes it the better detection metric.
Turnover and days on hand
Annual cost of supplies used divided by average inventory value gives you turns, and the target is four to six. Days on hand is 365 divided by turns, so four to six turns is roughly 60 to 90 days of stock. Pearl separately suggests holding a 30 to 60 day supply, which implies a faster six to 12 turns. Pick whichever matches your ordering cadence: practices ordering monthly should sit at the 30 to 60 day end, quarterly orderers nearer four to six turns.
The bulk buy break even test
Six extra months of stock ties up about half that quantity on average as it draws down, so at 20 to 30 percent carrying cost a year the real penalty is roughly 5 to 8 percent of the purchase value. A 5 percent bulk discount is break even at best. A 10 percent one only pays if the item turns reliably and does not expire first, which at small practice volume is exactly the part that fails.
This is also where cost control and inventory efficiency turn out to be the same project. An inaccurate count produces both failure modes at once: rush orders on one side, expiration waste on the other. You cannot buy your way to a lower supply percentage without first being able to count.
Comparison that runs on every order
More than 200,000 normalized SKUs, so you are comparing true equivalents instead of similar sounding catalog names. See which distributors are supported.
What Backfires
Downgrading clinical materials to hit a percentage. Remakes and redos burn chair time and lab fees that dwarf whatever the cheaper material saved. This is the most expensive mistake on the list and it always looks like a win for a quarter.
Cutting infection control supplies. The CDC is categorical on single use devices: use them for one patient, then dispose of them, and if a device has no reprocessing instructions, consider it single use regardless of how it is labeled.
Buying gray market product. The Ohio Dental Association warns that diverted supplies may have compromised quality from improper handling or storage, fall outside manufacturer warranties, and can end in lawsuits from dissatisfied patients. A discount that ends in a remake and a complaint was never a discount.
Chasing the cheapest unit price everywhere. A win that adds four vendor relationships, four sets of shipping minimums, and four hours of staff time a month is a net loss with good optics.
Accepting lock in for a discount. Group purchasing organizations are funded through vendor fees, member fees, or commissions on the savings they generate, as Dental Economics laid out, and which model you are in determines what actually reaches your bottom line. We put the comparison side by side on our ZenOne versus GPOs page.
How ZenOne Works Against This
- Price comparison at reorder across the distributors you already use, matched against more than 200,000 normalized SKUs. That is lever 1 running automatically on every order instead of quarterly by hand.
- Live counts from barcode and QR check in and check out, which is what makes levers 3, 4, and 5 possible at all, with reorder alerts on threshold and spend reporting against the collections benchmark.
- No distributor lock in. ZenOne routes each order to the best price rather than replacing the vendor relationship, which is a direct answer to the last item in the backfire list.
- Collective volume is the mechanism. Pooled volume across the more than 1,400 dental professionals on the platform is how a private practice gets pricing power it cannot generate alone.
- Proof in a real practice’s numbers. Dr. Brandon Johnson at Brushy Creek Dentistry spends roughly $10,000 a month on supplies and saves about 20 percent, which you can read alongside the rest on the customer wall.
Frequently Asked Questions
What percentage of collections should dental supplies be? The ADA puts inventory costs at no more than 5 to 6 percent of collections, with office supplies as a separate bucket of about 2 percent, and recommends that no single month exceed 6 percent of the prior month’s collections. Dental CPA data suggests the average practice runs above that.
Why is my supply percentage higher than the benchmark? Before assuming it is a purchasing problem, check the coding. Equipment purchases and equipment repairs bought through a dental supplier frequently land in the supplies category and inflate the ratio. The ADA’s threshold is $500 per item, not per invoice.
What is the fastest way to reduce dental supply costs? Price comparison on your top 20 items by spend. It requires no clinical change, no vendor switch, and no new habits from the team, and most of your spend is concentrated in a small number of line items.
Are bulk discounts worth it? Often not at small practice volume. With carrying costs at 20 to 30 percent of inventory value per year, six extra months of stock costs roughly 5 to 8 percent of the purchase value in tied up cash, so a 5 percent discount is about break even before you account for the risk of the product expiring or being discontinued.
Should a small practice join a group purchasing organization? It depends on how the GPO is funded and whether membership restricts which distributors you can use. Ask who pays the organization, because vendor funded models, member funded models, and commission models produce different net outcomes for you.
Conclusion
The benchmark confusion resolves the moment you separate targets from behavior. The target is 5 to 6 percent of collections, most practices sit above it, and the distance between the two is measured in tens of thousands of dollars a year. Every lever that closes it depends on the same foundation: knowing what you have and what you actually use.
ZenOne is dentist owned, and founder Tiger Safarov built it around collective volume for a specific reason. Supply cost is one of the few overhead lines a private practice can move without giving up ownership, and moving it should be a matter of visibility rather than sacrifice.
Find the point you are leaving on the table
Compare prices across every distributor you already use and see the gap on your own item list, not on someone else’s average. Book a Demo with ZenOne.
Join 1400+ dental professionals, shop from your favorite
suppliers, compare prices instantly, and save over $17,000/year
Try our platform free for 14 days.
Get the latest ZenOne updates and product launches in your inbox
Don't miss the latest news!
Receive exclusive offers and news straight to your inbox!
Continue reading
10/23/2026
~ 7 minutes to read
10/02/2026
~ 7 minutes to read
09/23/2026
~ 7 minutes to read
Let's discover how we can help you

Tiger Safarov
Hi, I'm Tiger, the CEO at ZenOne, and I'm happy to personally ensure your success with ZenOne. Send me your latest invoice or a statement for a Free Savings Analysis.
Ask me a question:

