


Miranda Moore
RDA Lead Assistant, Beacon Dentistry
01/15/2026
Dental Practice Overhead Benchmarks and Cost Breakdown

~ 8 minutes to read
Many dental practices use total overhead of about 60-65% of collections as a starting comparison. This usually means operating costs before owner dentist compensation. Practice type, location and accounting choices can change the result.
Start with your own profit and loss statement. Calculate total overhead, then compare payroll, dental supplies, lab fees, facility costs and other expenses separately. The 60-65% dental office overhead range can help you spot a concern, but it shouldn’t replace a review with your accountant.
Supply costs are often one of the fastest categories to check. ZenOne helps practices track inventory and compare prices across dental suppliers.
Dental Practice Overhead Percentages: Quick Answer for 2026
This dental practice overhead breakdown separates total overhead from the expense categories that create it. A common planning range is 55-65% of collections. Many published comparisons place the average dental office overhead closer to 60-65%. Use the same expense rules each month so the comparison stays valid.
- Comparison range: 55-65% of collections under the expense definition used by the source
- First check: Find the expense category furthest above its usual range
- Fast supply check: Review price changes, expired stock and rush orders
| Category | Comparison Range | Measurement Basis | Source Used |
| Total overhead | 55-65% | Collections, usually before owner dentist compensation | Overjet, 2025 |
| Staff | 25-30% | Collections. Confirm whether benefits and payroll taxes are included | Overjet, 2025 |
| Clinical supplies | 4-6% | Collections. Keep equipment purchases separate | Planning range used in this article |
| Lab fees | 6-8% | Collections. Results change with case mix | GoTu, 2026 |
| Facility | 6-10% | Collections. Location and practice size affect this figure | Planning range used in this article |
| Marketing | 4-7% | Annual collections for an established practice | My Social Practice, 2025 |
How to read this table: Each range is a comparison point. Check whether a source uses collections or production and whether owner or associate pay is included. Compare your practice with the same measurement basis.
Why Most Practices Miss Overhead Benchmarks
Small increases across payroll, supplies, lab work and office costs can raise total overhead. Measure each category monthly. Start with the largest unexplained change.
Real Examples: How Dental Teams Cut Overhead Without Cutting Care
These actions work in real dental offices and can be measured each month.
- Supplies: Stop “panic ordering.” Set par levels so you don’t pay rush prices.
- Staffing: Track production per team member each month so you don’t overstaff for slow weeks.
- Lab: Review your top 10 lab cases and make sure you’re not paying premium fees for routine work.
- Facility: Check if you’re paying for space you don’t actually use.
- Tracking: Calculate overhead monthly so problems don’t hide until year-end.
What Are Dental Practice Overhead Benchmarks in 2026?
Overjet reported in 2025 that the national median was about 62% of collections. It placed many high-performing practices near 55-60%. These figures only help when your practice uses the same expense definition.
Blue & Co., a dental CPA firm, reported a 39% margin before debt service for its top-performing group in 2025. Margin and overhead aren’t always exact opposites. Income definitions, doctor pay and debt treatment can differ.
Why Dental Office Overhead Benchmarks Differ
Practice size, specialty, location and procedure mix can change dental office overhead percentages. Accounting choices matter too. Some reports exclude owner dentist pay. Others treat associate dentist pay as labor.
The ADA Health Policy Institute data discussed by Overjet also shows differences by practice size. Larger practices can spread fixed costs across more collections. Smaller practices may report a higher percentage even when their spending is controlled.
Pick one method and use it every month. If you switch methods, record the change so a lower or higher percentage isn’t mistaken for a real spending shift.
What Counts as Overhead?
Overhead includes the operating expenses required to run the practice. Many dental benchmarks exclude owner dentist compensation. Treatment of associate pay can differ, so confirm the source’s method before comparing figures.
- Personnel costs: Staff salaries, benefits and payroll taxes for hygienists, assistants and administrative team members
- Clinical costs: Dental supplies, laboratory fees and in-house lab expenses
- Facility expenses: Rent or mortgage payments, utilities, maintenance, equipment leases and repairs
- Administrative costs: Accounting fees, insurance premiums, software subscriptions, professional memberships and office supplies
Use one rule for doctor pay: Separate owner dentist compensation in your records. Ask your accountant how associate pay should be treated for the benchmark you use.
Dental Practice Overhead Calculator
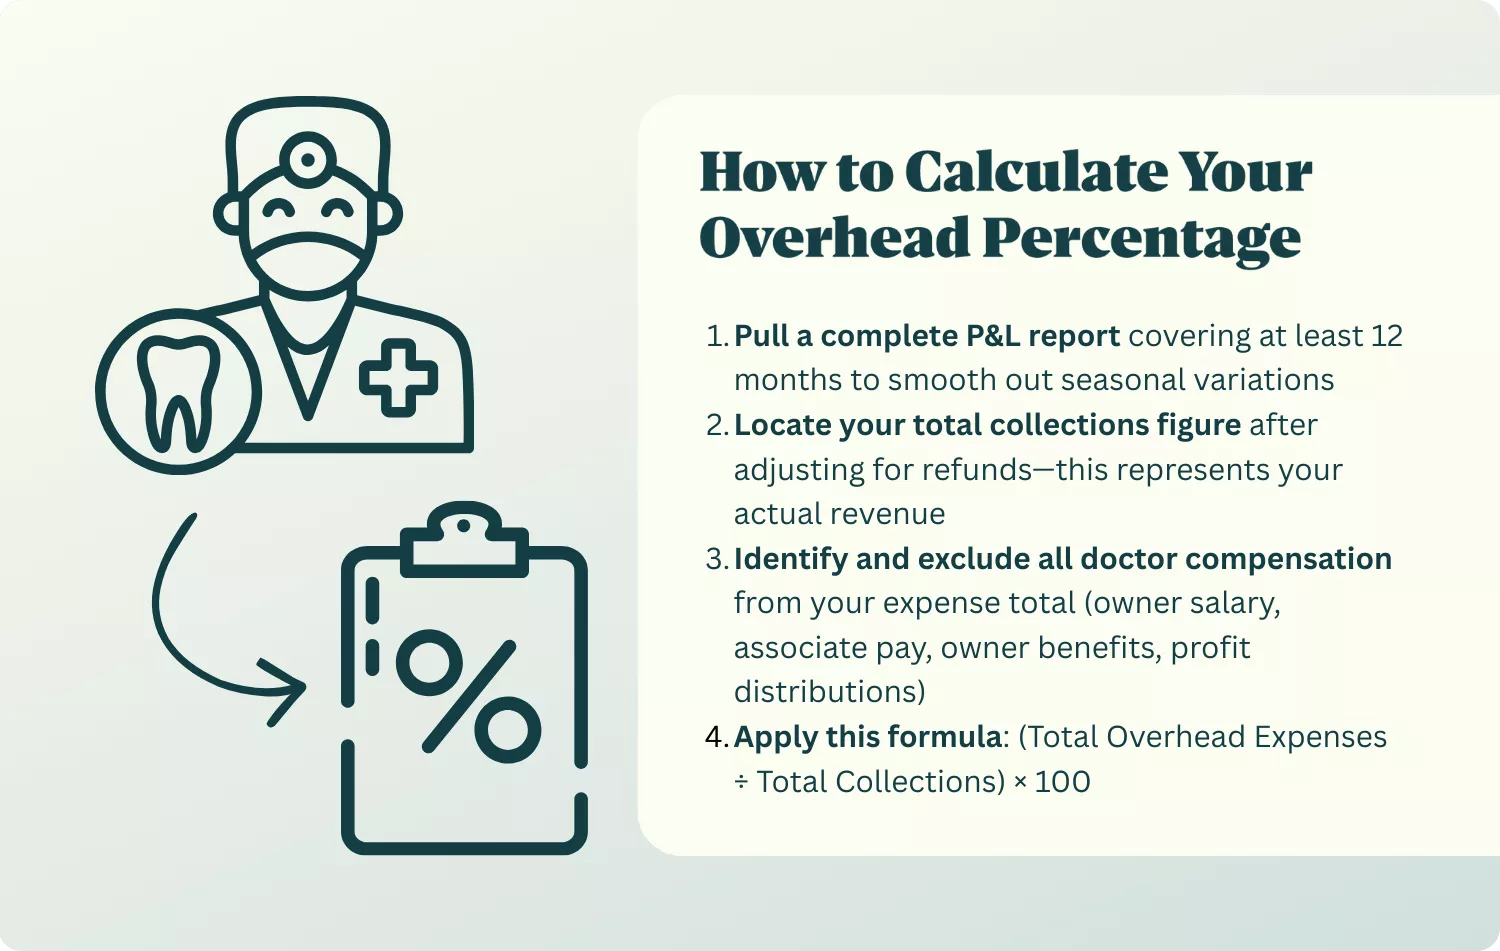
Overhead Percentage Formula
Overhead percentage = operating expenses under your chosen definition ÷ collections × 100
- Pull a complete P&L report covering at least 12 months.
- Find total collections after refunds.
- Separate owner dentist compensation. Record whether your chosen benchmark includes associate pay.
- Divide the included operating expenses by collections, then multiply by 100.
Example: A practice collected $1 million and recorded $620,000 in included operating expenses. Its overhead percentage is 62%.
Worked Example
- Collections: $1,200,000
- Total overhead expenses: $720,000
- Owner dentist compensation excluded: Yes
- Overhead percentage: 60%
- What this means: The result falls within a common comparison range. The practice should still review each category monthly.
What to Review Based on Your Result
| Result | First Review |
| Within your comparison range | Check whether one category is rising faster than collections |
| Slightly above the range | Compare the last three months with the prior three months |
| Well above the range | Find the category furthest above its usual percentage |
| One-month spike | Check for equipment, annual fees or unusual purchases |
Start with the category furthest from its usual percentage. Cutting every expense by the same amount can hurt patient care and staff retention.
Dental Supply Costs: A Fast Category to Review
Staff often represents the largest expense. Dental supplies can be faster to review because prices, waste and rush orders are easy to track. Compare supply spending with collections and your own 12-month history.
Where Dental Supply Spending Goes Off Track
Check these common sources of added cost:
- Emergency orders at premium prices
- Expired materials that must be discarded
- Excessive safety stock that ties up cash
- Inconsistent pricing for identical products from order to order
If supply costs grow faster than collections, check unit prices and usage before blaming one cause. The change may come from a supplier increase, new procedures, waste, theft or a shift in order size.
Reported result: Dr. Brandon Johnson of Brushy Creek Dentistry was “spending so many hours on eBay, Net32 and Amazon just trying to find the best price.” After changing how the practice compares prices through ZenOne, he reported saving $2,000 per month on about $10,000 in monthly supply spending. Results vary by order mix, supplier access and staff use.
5 Ways to Cut Supply Costs Without Sacrificing Quality
1. Compare current prices across suppliers
ZenOne shows side-by-side prices from more than 50 dental suppliers. Compare the exact SKU, package size, shipping cost and available discount before choosing a seller.
2. Set par levels from actual use
Track use by operatory. Set a low-stock alert when an item reaches its reorder point.
3. Standardize your product formulary
Review similar products that serve the same purpose. Keep clinical choices approved by the dentists while reducing needless duplicates.
4. Review contracts, rebates and order minimums
Compare contract prices with the full delivered cost. A rebate can lose value when shipping, order minimums or unused stock add expense.
5. Audit high-cost items each quarter
Use a variance log to record the expected count, actual count, value and reason for each difference.
Compare your supply-ordering options and see where ZenOne may reduce cost or staff time.
Why Dental Supply Prices Vary Between Companies
Dental supply prices can differ because of distributor costs, order volume, contracts, rebates, shipping and current stock. A lower item price can still cost more after shipping or package-size differences.
Run this price check once each quarter:
- Pull your top 10 most-purchased items from the last 90 days.
- Compare the delivered unit price across at least three suppliers.
- Confirm the SKU, package size, shipping and discount before marking an item cheaper.
- Record the lowest delivered unit cost and an approved backup supplier.
- Check the price again before the next large order.
Other Dental Overhead Categories to Review
Staff Costs
Staff is often the largest expense category. Compare payroll with collections, scheduled hours and patient demand. Use industry benchmarks as a reference, then check your own production and staffing data before changing hours or roles.
Checks:
- Cross-train team members to match labor to demand
- Compare scheduled hours with actual patient demand
- Track hiring, training and lost production tied to turnover
Lab Fees
A common comparison range for general practices is 6-8% of collections. The right comparison depends on case mix and the amount of lab work sent outside the practice.
Checks:
- Negotiate with multiple laboratories for competitive pricing
- Consolidate work for volume discounts
- Review case mix for in-house milling opportunities
- Track lab fees monthly as a percentage of collections
The 2025 Dental Industry Outlook discusses reported lab-cost reductions tied to vendor management. Compare those examples with your own invoices before setting a savings target.
Facility Costs
Published comparisons place facility costs within a wide range. Location, square footage and practice size can change the percentage.
Overjet’s 2025 analysis explains that higher-volume practices can spread fixed costs across more patients. Compare your space cost with collections per operatory and the amount of unused space.
Checks:
- Energy efficiency upgrades for older facilities
- Negotiate lease renewals well in advance
- Evaluate whether square footage matches operational needs
Marketing Costs
One published comparison places marketing near 4-7% of annual collections for established practices. A newer practice may spend more while building its patient base.
Track cost per new patient and collected revenue from those patients. A lower marketing percentage can still be wasteful when it doesn’t bring suitable cases.
Signs Your Dental Practice May Be Overspending
Supply Warning Signs
- Supply costs rising faster than collections for several months
- Frequent inventory stockouts requiring emergency orders
- Expired materials discovered during inventory counts
- Multiple staff placing orders without centralized oversight
- Can’t quickly produce a list of top 10 supply expenses
Overall Practice Warning Signs
- Overhead rising for several months without a planned investment
- Production per dentist stagnating while expenses rise
- Cash flow problems despite adequate production
- Collections per paid staff hour falling without a known cause
Reported result: Miranda Moore was ordering from 18 vendors. She reported that each order took two to three hours. After moving the work into ZenOne, she reported that ordering took 15-20 minutes.
Your Next Dental Overhead Review
On $1 million in collections, the difference between 55% and 70% overhead is $150,000. That math doesn’t show which costs are safe to change. Review each category before cutting spending.
Real results from practices using ZenOne:
- Dr. Brandon Johnson: reported saving $24,000 per year through price comparison
- Dr. Nikki: reported reclaiming 12 days per year by assigning ordering to the team
- Miranda Moore: reported an 85% reduction in ordering time
Start with the expense category that changed most. For dental supplies, review unit prices, rush orders, expired products and duplicate items. For staffing and facility costs, compare spending with patient demand and collections.
Compare your current supply process with ZenOne to see whether price comparison, inventory tracking and one ordering record fit your practice.
Related Next Steps
- How to Manage Dental Inventory in Your Clinic
- How to Save Money on Dental Supplies
- The Myth of the 5% Dental Supplies Budget
Dental Practice Overhead Answers
A Common Dental Practice Overhead Range
A common comparison range is 55-65% of collections. The result only has meaning when your expense definition matches the source. Specialty, size and location can change the percentage.
Dental Practice Marketing Spending
Published guidance often places marketing near 4-7% of annual collections for an established practice. Track cost per new patient and collected revenue. Those measures show whether the spending is working.
Overhead Review Schedule
Calculate overhead each month. Review category changes each quarter and compare the full year with the prior year. Include fee and overhead trends when deciding whether prices still cover rising costs.
Startup Dental Practice Overhead
A startup can report a higher overhead percentage while patient volume grows. It may also face large startup costs that shouldn’t be mixed with normal monthly operating expenses. Track startup purchases separately and ask your accountant how to classify them.
Benchmark sources last checked August 2026. Ask a dental CPA or accountant to confirm how your practice should classify owner and associate compensation.
Join 1400+ dental professionals, shop from your favorite
suppliers, compare prices instantly, and save over $17,000/year
Try our platform free for 14 days.
Get the latest ZenOne updates and product launches in your inbox
Don't miss the latest news!
Receive exclusive offers and news straight to your inbox!
Continue reading
10/02/2026
~ 7 minutes to read
09/23/2026
~ 7 minutes to read
09/11/2026
~ 7 minutes to read
Let's discover how we can help you

Tiger Safarov
Hi, I'm Tiger, the CEO at ZenOne, and I'm happy to personally ensure your success with ZenOne. Send me your latest invoice or a statement for a Free Savings Analysis.
Ask me a question:

